If you’ve glanced at oil prices recently, you probably noticed they’re on the move — and not in a small way. After months of relatively stable crude prices, the market has suddenly snapped to attention as tensions between Israel and Iran heat up, sending both WTI and Brent crude soaring. Investors are waking up to what seasoned commodity traders already know: nothing rattles global oil markets like conflict in the Middle East.
But here’s the twist — while the drama plays out half a world away, the biggest winners may be oil producers right here in the United States.
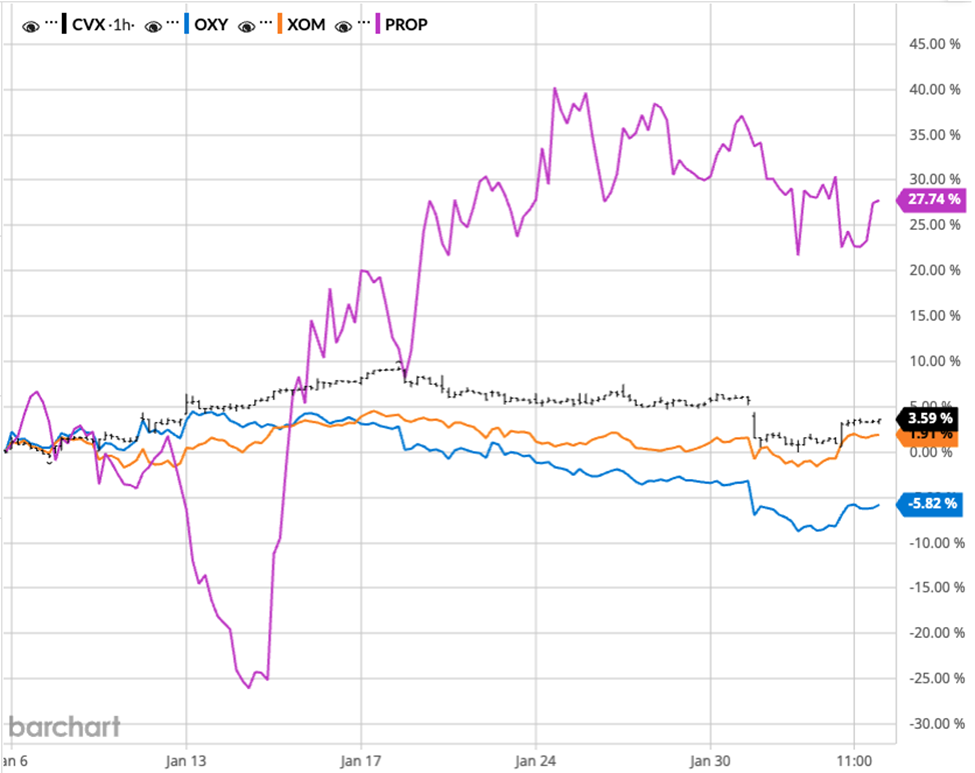
Let’s break down why this conflict is pushing prices higher, and how U.S.-focused companies — especially Devon Energy, U.S. Energy Corp., and Prairie Operating Company — are perfectly positioned to capitalize on this volatility.
When Missiles Fly, Oil Rallies
The Middle East has long been a powder keg, but the current standoff between Israel and Iran is dangerously close to boiling over. In just the past few weeks, both countries have launched strikes against each other’s critical infrastructure — with rumors swirling that Iran may attempt to choke off the Strait of Hormuz, a narrow passageway through which nearly 20% of the world’s oil supply flows daily.
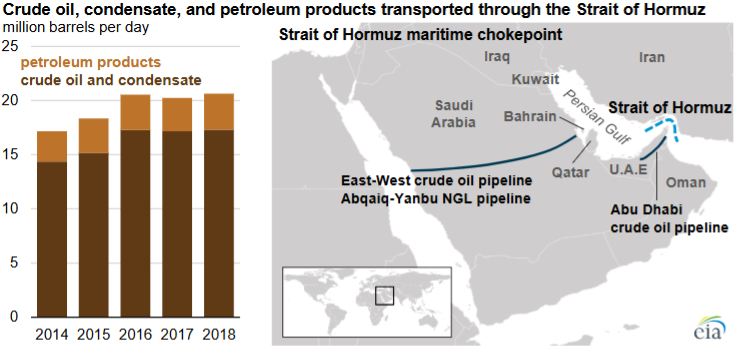
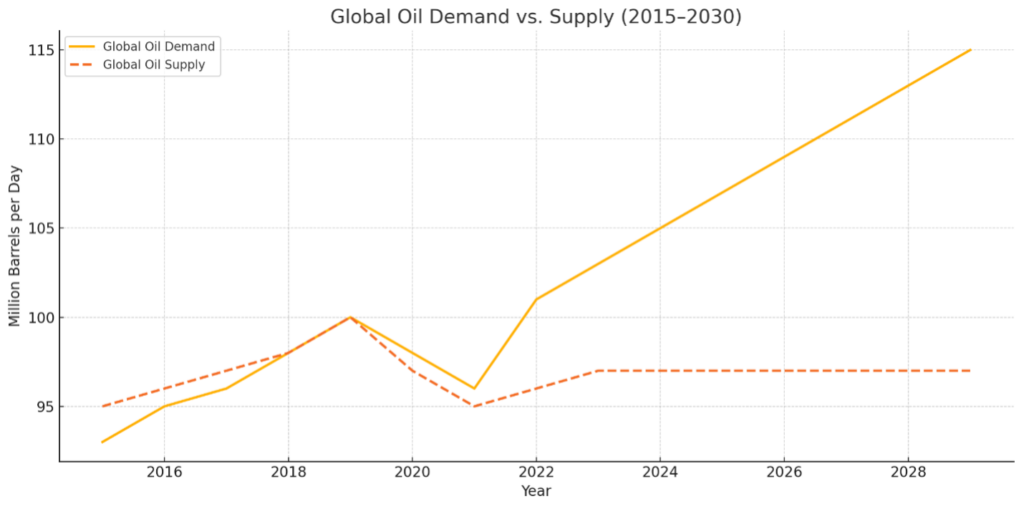
Even the threat of disruption in that region sends shockwaves through global markets. Why? Because oil, unlike most commodities, is deeply intertwined with geopolitics. When producers or transport routes are at risk, traders rush to price in that uncertainty — and that means higher prices across the board.
As this latest conflict escalates, it’s not just a regional issue. It’s a global supply risk. And when global supply is in question, demand shifts to where oil is safest and most accessible: the good old U.S. of A.
Domestic Oil Is Suddenly Worth a Whole Lot More
What investors are realizing — and what you should be paying close attention to — is that U.S.-based oil production becomes far more valuable in times like this. It’s not subject to international shipping lanes, foreign sanctions, or political sabotage. It’s drilled, piped, refined, and sold domestically.
And that’s why the spotlight is turning toward smaller, more nimble U.S. producers that operate exclusively on American soil. They don’t have to worry about supply chains being bombed or refineries being targeted. They just need to keep pumping — and enjoy the rising prices.
Let’s look at three companies that are about to ride this wave.
Devon Energy: The Established Powerhouse
Devon Energy (NYSE: DVN) is far from a penny stock — it’s a heavyweight in the U.S. oil patch. With operations across the Permian Basin, Eagle Ford, Anadarko Basin, and Powder River, Devon has one of the most diversified domestic asset portfolios in the industry. It’s a major producer, churning out more than 800,000 barrels of oil equivalent per day.
But here’s the key: it’s all U.S.-based…
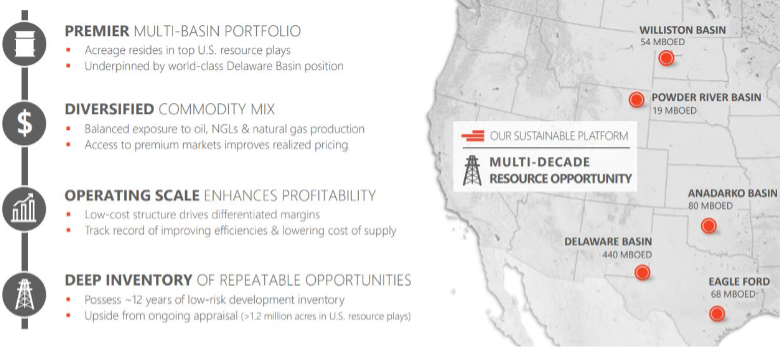
That means Devon gets the full benefit of higher oil prices without taking on the geopolitical risk that international producers face. While oil majors with global exposure have to worry about shipping routes and foreign governments, Devon just keeps drilling — and banking higher profits.
The company has been laser-focused on shareholder returns lately, with billions in free cash flow and a generous dividend. Rising oil prices only supercharge those cash flows, giving Devon more ammunition to return value to investors.
U.S. Energy Corp.: The Underdog with Upside
Now, let’s shift to a much smaller name with big leverage to rising prices — U.S. Energy Corp. (NASDAQ: USEG). This is a lean, nimble oil and gas company operating exclusively in the United States, with a focus on low-decline, high-margin assets in the Rockies and Gulf Coast.

Unlike some overextended peers, USEG has no debt and a clean balance sheet, which gives it room to grow production without financial strain. Its current production may be modest — just over 1,000 barrels per day — but when oil prices spike, even small volumes can generate serious cash for companies like this.
The beauty of a small player like USEG is that it’s pure. It doesn’t have downstream assets, international complications, or sprawling corporate overhead. It just drills, sells oil, and keeps the profits. And when the price per barrel jumps like it is now, those profits can rise exponentially.
In a high-volatility market, small domestic oil producers are often the fastest movers — and USEG fits that profile perfectly.
Prairie Operating Company: The Newcomer with Explosive Growth
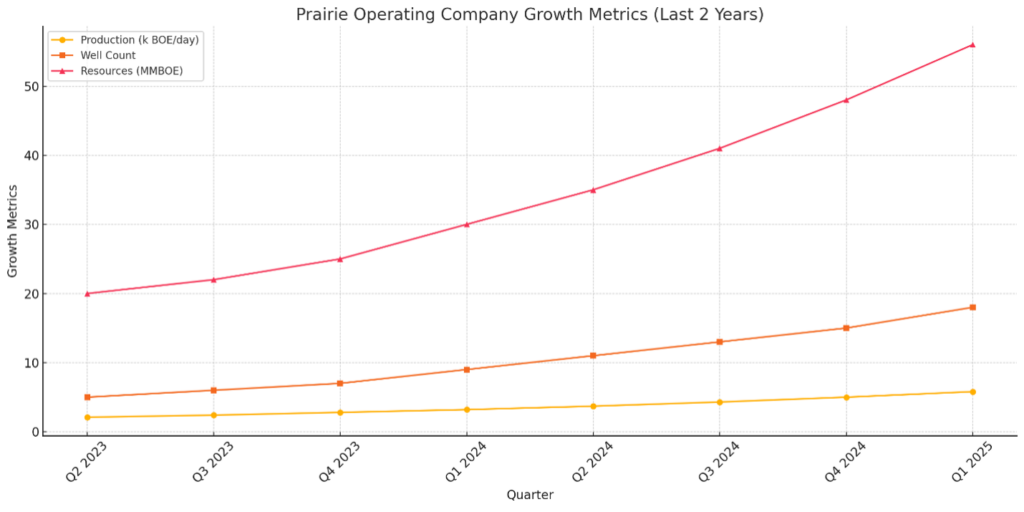
Finally, we have Prairie Operating Company (NASDAQ: PROP), a newer name that’s starting to attract serious investor interest — and for good reason.
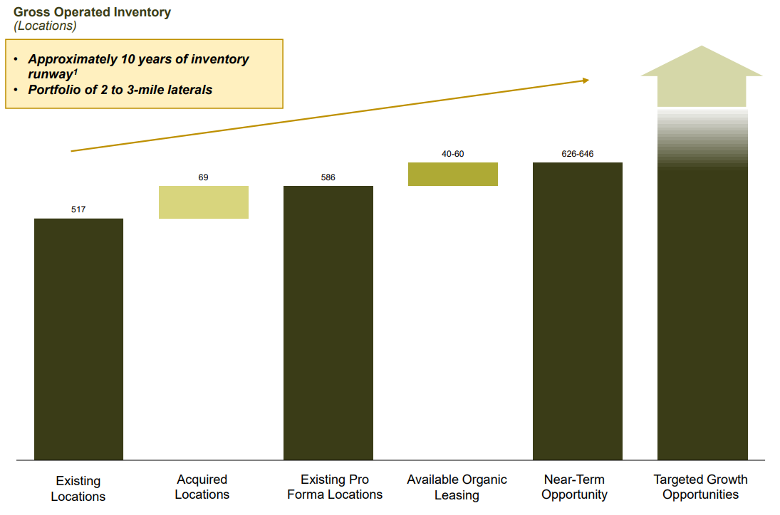
PROP operates primarily in the Denver-Julesburg (DJ) Basin, one of the most prolific onshore basins in the U.S. While still early in its growth curve, the company has aggressive plans for 2025: it expects to bring 25–28 new wells online and ramp production up to 7,000–8,000 barrels per day — nearly triple its 2024 output.
That kind of growth is impressive on its own, but in a rising oil price environment, it becomes potentially explosive. PROP is guiding for more than $100 million in EBITDA next year — and that estimate could prove conservative if oil continues its upward march.
For investors looking for a high-upside domestic play with momentum on its side, Prairie might be the dark horse that delivers the biggest gains.
The Takeaway: This Is America’s Energy Moment
While international oil producers scramble to manage risk in the Middle East, American companies with domestic-only operations are sitting in the catbird seat. They don’t have to worry about tankers being targeted or pipelines being blown up halfway across the world.
Instead, they’re focused on drilling, producing, and cashing in on a price surge they had no hand in creating — but will fully benefit from.
Devon Energy is the reliable giant with a long track record. U.S. Energy Corp. is the small-cap sleeper with leverage to every price uptick. And Prairie Operating is the growth rocket, ready to capitalize on a perfect storm of rising production and surging oil prices.
If you’re looking for a way to profit from global instability without global risk, these are the names to watch.
Want the Full Picture?
If you’re serious about understanding how America’s domestic oil producers are seizing the moment — and which company is the best-positioned to surge in the coming months — don’t miss our free, in-depth research report on U.S. energy dominance.
Inside, you’ll discover:
- The #1 American oil stock set to spike
- Why American energy is poised to dominate the global markets
- And how smart investors are using this window to build real wealth
It’s free, it’s actionable, and it’s yours for the asking.
👉 Get the report today and start positioning yourself before the next big move.
Neither The Investment Journal nor the author have a financial position in any of the companies mentioned in this article. An affiliate of The Investment Journal has been retained for marketing services by Prairie Operating Co. between June and August, 2025; however, this is not a sponsored post. This content is for informational purposes only and should not be considered investment advice or a solicitation to buy or sell any securities.