While financial gurus like to sound like they have some special insight into the market, no one has a crystal ball.

We’ll be the first to admit it.

Investing is about doing your due diligence.

Of course there are tools that can give a savvy investor some inside clues about the market.

It’s a little known technical indicator that measures an important statistic known as “market breadth” called the Advance/Decline Line.

It’s a tool that actually can give you a glimpse at the internal strength or weakness of any market. And best of all, it’s super-simple to use…

A Look “Inside” the Market

Market “breadth” shows the relative participation in a market move by measuring the number of shares that are moving higher versus the number moving lower — in other words whether a rally is broadly-based or being driven by a few big stocks. 

The math on this is ridiculously simple.

You just take the number of shares going up (usually over a trading session)  and subtract the number of shares that went down. Then add that number to the previous day’s number. 

Voila! Instant market insight.

The A/D line (as it’s known) can be a leading indicator by showing a deterioration in market strength if it starts to lag as prices are making new highs. It can also show accumulating strength in a bear trend by holding previous lows while prices are still heading lower.

Now that you understand the principles behind this indicator, let’s take a look at the A/D lines for four major indexes…

Four Indexes — Four A/D Lines

Let’s start with the big dog…

S&P 500

Source: MarketInOut

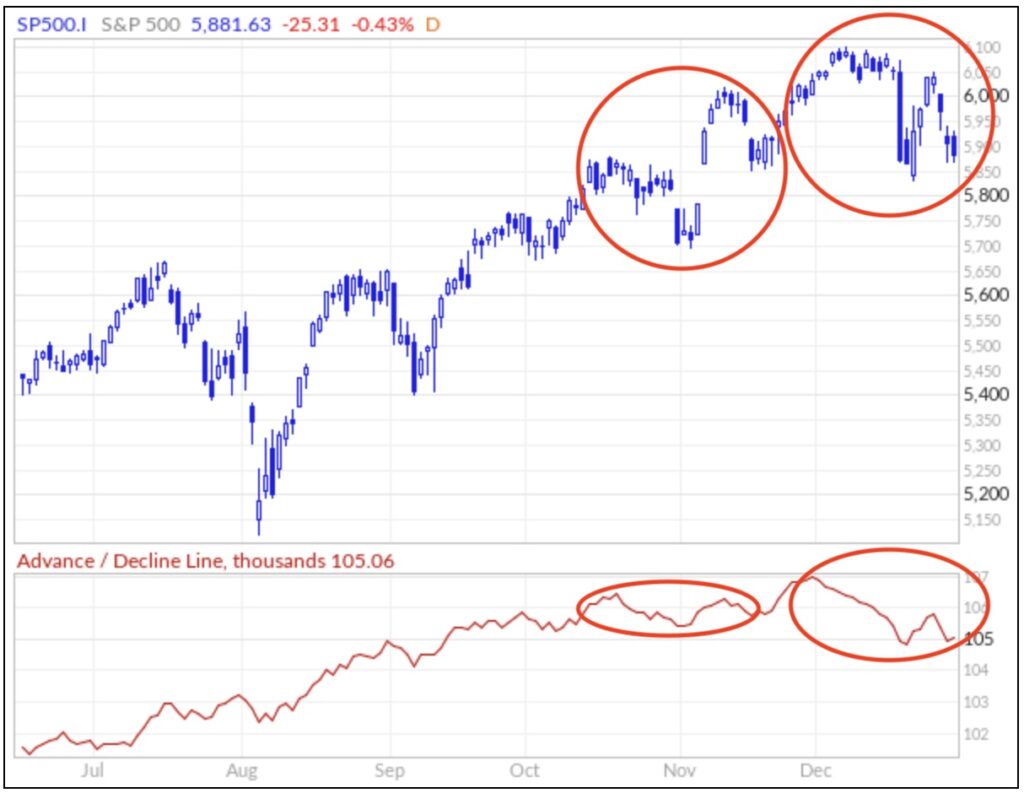
Look at the A/D line in the first circle compared with the price action. Market breadth appeared to be weakening as the A/D line couldn’t reach a new high with the market. It eventually did post a new high, but then fell off sharply as the market stalled. 

Right now the indicator appears to be relatively in line with the price action of the market. But continued weakness into the new year could mean more internal weakness. 

Dow Industrials Average
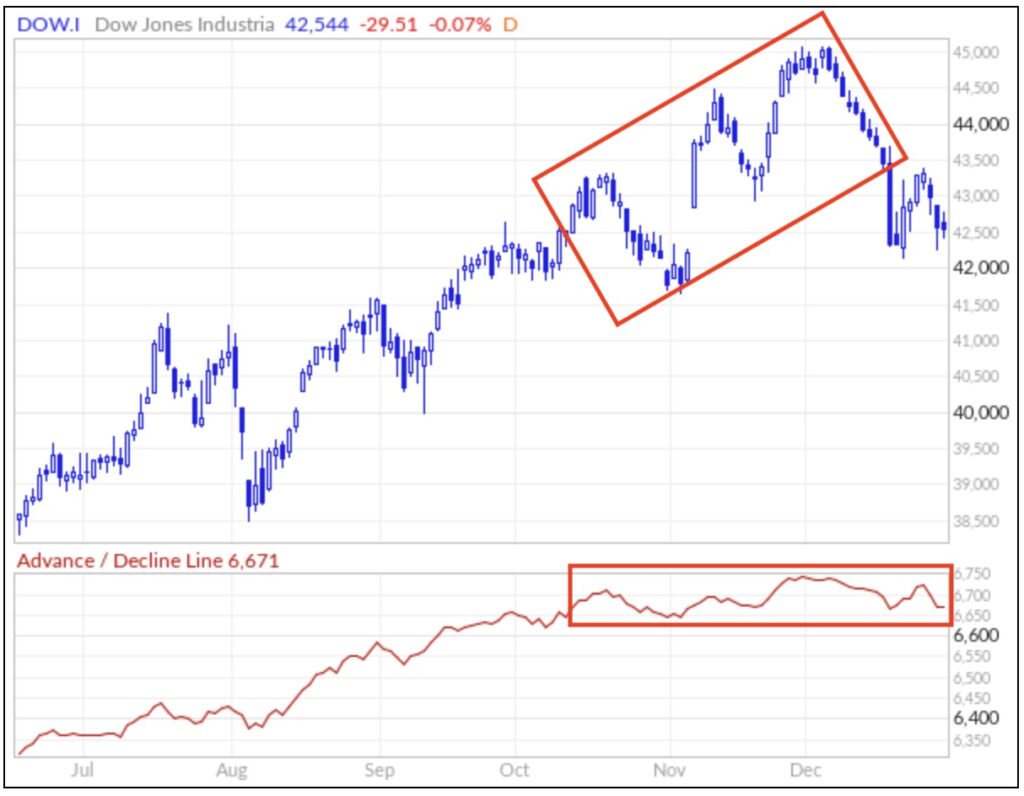

Source: MarketInOut

The Dow Industrials is only a 30 stock index, but it also contains $12.5 trillion in market cap with Nvidia, Apple, Microsoft and Amazon. So it’s got some pretty mega-tech companies to drive it. 

You can see the upward price bias throughout November, while the A/D line stayed basically flat. Year end profit taking pulled prices a bit back in line. But absent a confirmation by the indicator, new highs in the market should be viewed cautiously. 

NASDAQ Composite

Source: MarketInOut

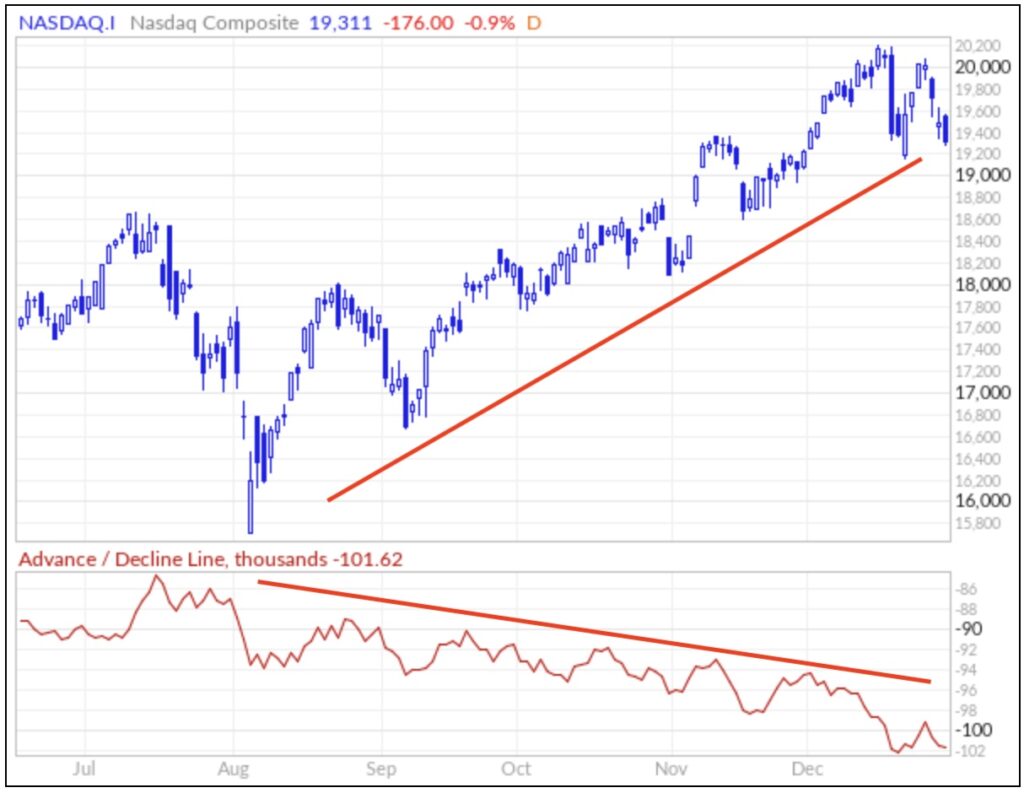
If you want a look at a troubling chart, look no further than the Nasdaq Composite. The Nasdaq is a capitalization-weighted index of 2,500 companies that lean heavily toward the tech sector. 

The index was up over 30% in 2024 while its A/D line had been heading significantly lower for most of the year. 

The price action is closer to what we’ve seen in the S&P 500 (another market-cap weighted index) but given the index contains 5-times as many stocks, this divergence between price and AD line drives home the fact that the rally is still in the hands of a handful of mega-tech companies. 
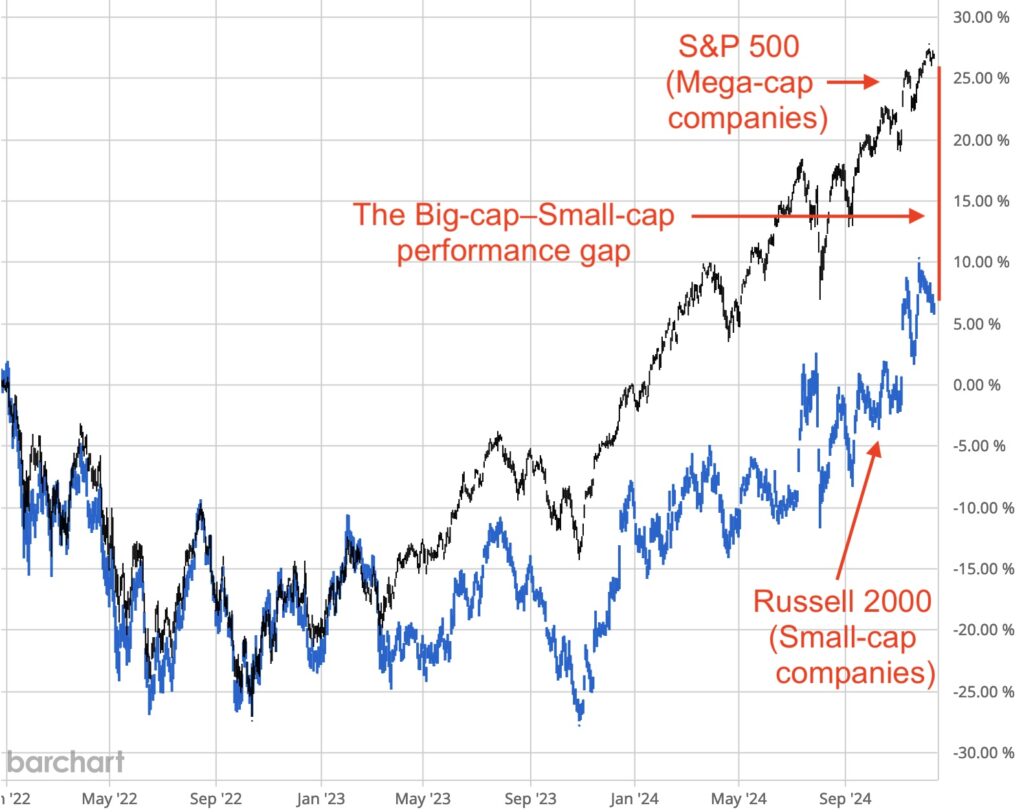
Russell 2000

Source: MarketInOut

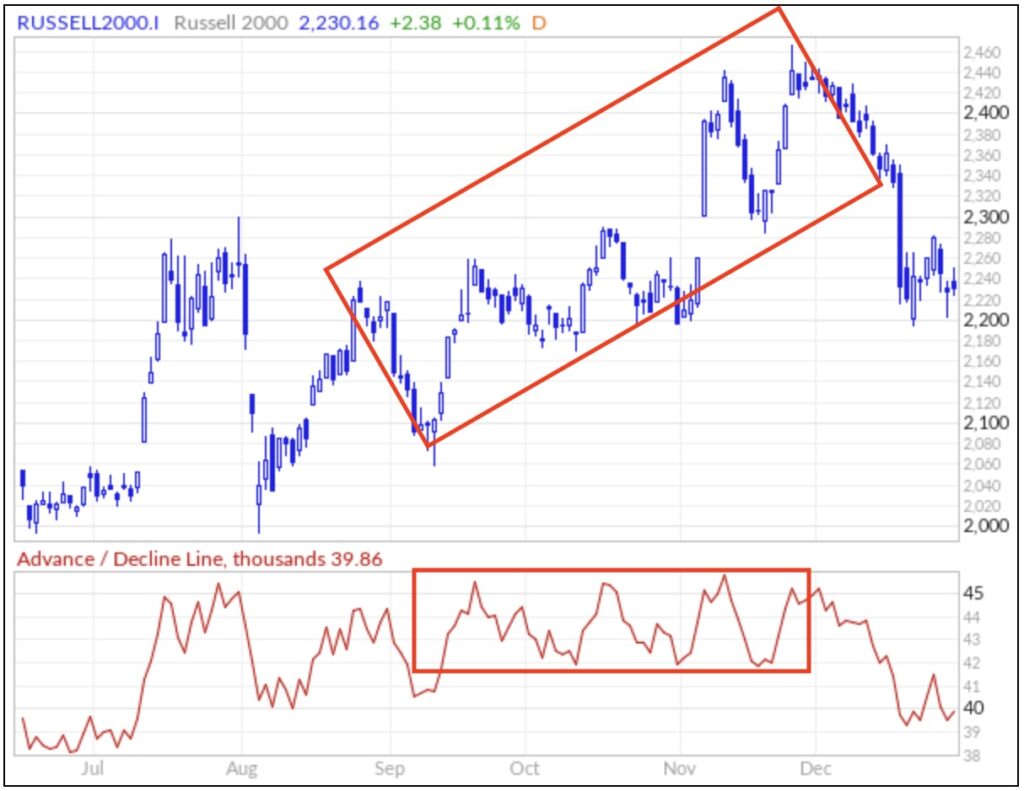
The Russell 2000 is an index of small cap companies. 

Small caps have been struggling. While the S&P 500 gained over 24% last year, the Russell Index managed less than half that rallying 10.8%. Here you can clearly see the divergence between the A/D line and the price action of the index. New price highs were made, but market breadth didn’t support it. 

The pullback has brought prices back into line somewhat, but the fact that the A/D line has moved so far below previous lows may be indicating the market is still under some stress. 

As Always: One Caveat…

To be sure, this indicator is not the “holy grail” of investing. There are no sure things

When it comes to the markets, “only price pays” — no matter what your indicators may be telling you, price is the only indicator that really matters!

Everything in your technical arsenal could be screaming “sell, sell, sell,” but if the market keeps going higher… It’s going higher. (Have another look at the Nasdaq Composite chart!)

It’s no secret that for the past two-plus years, it’s been basically a handful of stocks — the AI/mega-tech sector — that has been pulling the market higher. And they’ll continue to be an influence.

But all that said, technical indicators like the advance/decline line can offer important insights into what may be building internally in the market. 

And that’s always important for a smart investor to know.

Every year as we get around to pinning a new calendar to the wall, financial writers start focusing on two topics… the big events from the year gone by and the big opportunities for the coming one.

Many sites will make calls on certain stocks based on things like developing trends, companies’ past performance, and just enough analysis to justify their logic. 

(In all cases, we recommend that you always do your due diligence before investing in any opportunity, to make sure it fits in your investment goals and risk profile.) 

We don’t do that. But…

If you are interested in a small group of stocks that has the potential to outperform one of the major market indexes, there’s a strategy we’d like to introduce you to…

The “Dogs” of the Dow

What’s that?

The “Dogs” concept was popularized in 1991. It’s an investing strategy that looks to outperform the Dow Industrials by buying the 10 stocks in the index with the highest dividend yields

Why would this be a good idea?

A company’s dividend yield is its annual dividend divided by the share price of the stock. Let’s say Company X pays a $2.50 annual dividend and is currently trading for $27. That means it has a 9.2% dividend yield.

However, if Company X is trading for $19, its dividend yield would be over 13%.

So a higher dividend yield generally indicates a lower stock price. 

Remember, the Dow Industrials is an average of 30 of the bluest of the blue chip companies in the market. All solid, well-capitalized companies. Not a high-risk name in the bunch.

So when one of these stocks’ dividend yield rises, it usually means its price has come under some cyclical or temporary pressure. Which should make them poised to outperform the market as their share prices recover.

How does it work?

The Dogs of the Dow is basically a “set it and forget it” strategy. You buy the Dogs in January, hold them through the year, and then adjust your holdings for the following year.

Simple.

But how does it perform?

You might be surprised. 

A Pretty Impressive Record

In an era of Nvidia-like return expectations, a lot of investors think of dividend paying stocks as “stodgy” companies that can’t keep up the growth pace with the rest of the market. But these “Dogs” have done pretty well relative to the DJIA index.

Between 2007 and 2009, the Dogs portfolio was beaten by the Dow, but…

In 2010 it was Dogs up 16% – Dow plus 9%…

In 2011 the Dogs beat the Dow by 11 percentage points…

In 2012 it was a dead heat with both rising roughly 10%…

In 2013 it was the Dogs again closing up 35% vs the Dow’s 30%…

In 2014 it was a closer contest with the Dogs up 11% and the Dow up 10%…

In 2015 the Dogs gained 3% while the Dow was flat…

In 2016 it was Dogs up 20% and the Dow up 17%…

In 2017 the Dogs took it on the chin gaining 19% vs. the Dow’s 25% rise…

In 2018 the Dogs fell 1.5% while the Dow dropped 6%…

In 2019 the Dogs managed a 15.4% gain while the Dow posted a 22.3% rise…

In 2020 the Dogs got clobbered losing 12.6% while the Dow gained 7.2%…

In 2021 the Dogs got some revenge rallying 25.3% compared to 21% for the Dow…

In 2022 it was Dogs plus 2.2% – Dow minus 8.8%…

And in 2023 the Dogs got edged gaining 10.1% vs the Dow’s 14.4% move.

Overall, according to Nasdaq, “From 2000 to 2022, the Dogs of the Dow had an average annual return of 8.7% compared to 5.8% for the Dow Jones Industrial Average (DJIA).”

What about last year?

In 2024 the Dogs were, well… dogs. The portfolio lost 2.97% while the Dow as a whole was up 12.8%.

Their performance lagged in large part on the backs of healthcare/pharmaceutical stocks. Amgen was down 9.5% and Johnson & Johnson fell 7.7%. But the biggest loser in the bunch was Walgreens which took a huge 64.3% hit thanks to a combination of bad business decisions and industry pricing pressures.

Chemical conglomerate Dow Inc. also took a dive dropping 26.8%.

The only two tech stocks, IBM and Cisco gained 34.4% and 17.2% respectively. 

One of the chief criticisms of the strategy is that it may overweight an investor in one particular sector. That appears to have been a factor.

But it’s also worth noting that the Dogs have a tendency to bounce back. If you look at the returns above, the Dogs portfolio got its butt kicked in 2020 only to rebound to outperform in 2021. (And Walgreens got dropped from the index.)

So are the Dogs of the Dow right for you?

Only you can determine that by doing your due diligence. 

But if you are interested in looking into this unique portfolio, here are the Dogs for 2025…

Verizon (VZ) — 6.78%

Chevron (CVX) — 4.50%

Amgen (AMGN) — 3.65%

Johnson & Johnson (JNJ) — 3.43%

Merck (MRK) — 3.26%

Coca-Cola (KO) — 3.12%

IBM (IBM) — 3.04%

Cisco Systems (CSCO) — 2.70%

McDonalds (MCD) — 2.44%

Procter & Gamble (PG) — 2.40%

It’s a sad commentary on the state of the US economy. 

We wrote about it in an earlier post…

Not so long ago, when the US economy was a value-based engine, the stock market could be considered a decent measure of economic activity. 

Manufacturing companies who produced and sold more products earned more money. And investors in those companies were rewarded with higher share prices and often dividend payouts.

Everyone’s a winner.

Today we no longer live in a traditional value-based economy. Sure, we have industries that produce stuff that’s sold here and around the world. But more and more that continues to change.

Today, and for the past roughly 50 years, the stock market has turned from a measure of an industrial economy into a tool of financial elites.

A means to make money from money. Period.

The latest chapter appears to have finally hit home.

A Shadow of Its Former Self

Originally formed in 1901, US Steel (X) became the first $1 billion company and was one of the key drivers of the US’ global economic dominance during the era.

Global advances in steel production technology, however, soon saw US Steel’s market dominance fade. 

In 1991, X was removed from the Dow Jones Industrial Average after 90 years.

Today the company is only one of four major US steel manufacturers and ranks third in both steel production (as of 2023) and market cap. According to Reuters: 

U.S. Steel has reported nine consecutive quarters of falling profits amid a global downturn in the steel industry.

And that has come while protective tariffs from the last two administrations have been in force — an attempt to level the price playing field against none other than China who dominates the steel production industry today.

Source: WikiMedia

Over a year ago, however, a major suitor turned up knocking on US Steel’s door. Nippon Steel (NPSCY), Japan’s largest steel producer made an overture to acquire US Steel and in December 2023 a tentative deal was announced.

Nippon Steel bid $14.9 billion for a company that’s only worth $6.9 billion today.  They also offered, “a last-ditch gambit to give the U.S. government veto power over changes to output.”

No luck…

Just last week, President Biden officially blocked the acquisition citing national security concerns. (Full disclosure: President-Elect Trump promised to do the same thing.) 

US Steel stock dropped 6.5% on the news. Over the past year, the company is down over 36%.

It’s understandable that the US would want to protect one of its key industries from foreign ownership.

The problem (and sad reality) is the steel industry is not so important in the US anymore.

The other reality is that Japan is a close ally of the US, not an adversary.

Over the past decades, the US has seen the vast majority of its steel producing capability offshore itself overseas. (Not unlike the semiconductor industry.) 

Another reality is that to reclaim it today, would be a tall, if not impossible, order. 

Given the importance of the industry, maybe some form of “ally-shoring” would be a viable solution to rebuild an industry…

The FOMC is closed out 2024 this week. 

While humbly bragging that inflation is well under control, they’ve set off in search of more “neutral” interest rate levels to ward off any slowdown in the economy.

Most media will tell you that they have spectacularly engineered the elusive “soft landing.” And that you don’t realize how good you’ve got it!

Others would beg to disagree..

They’ll point out Donald Trump won the White House in pretty amazing fashion based on the fact that Bidenomics and the economy it created both sucked. 

Each camp comes to their conclusion based on the measuring stick they use. 

And there’s more than one way to measure an inflation monster…

Welcome to “Sticky-ville”

As if there weren’t enough ways to demonstrate how badly the economy is treating you, the Atlanta Fed itself has devised another. It’s called the Sticky-Price CPI.

What is that?

The Atlanta Fed started tinkering with this measure nearly ten years ago. The idea behind it is that some items in the CPI basket change very rapidly in response to economic factors (they’re known as “flexible”) while other items change much more slowly (they’re “sticky”).

The big question on everybody’s mind was whether either of these groups was a better predictor of different drivers of inflation. In other words, was either one a better forecast tool.

After examining the data for a bit, they discovered that half of the categories change their prices every 4.3 months. So they used that as their cut off. 

Items with prices that changed more frequently (like, say, tomatoes) were dubbed “flexible” while those that moved less frequently (like coin-operated laundries) fell into the “sticky” basket. 

When you plot the two categories, they look pretty much like you’d expect:

Source: Federal Reserve Bank of Atlanta

But the trillion dollar question was still was either basket a better predictor?

To determine that, they dove into some high-level math. They used something called the root mean squared error (RSME) which is a statistical way to measure how accurate a prediction is. 

They compared the RMSE of each basket to the RMSE of the forecast produced from the headline CPI at intervals of one month, three months, 12 months and 24 months out. (We’ll skip the boring math discussion.) What you need to know is that according to the Fed…

A relative RMSE less than 1.0 indicates that the alternative proxy for inflation expectations is more accurate than the headline CPI.

The results were undeniable. 

The one month forecasts were all about equal. But, starting with three months out, the sticky and core sticky baskets proved to be better forecasters. And they became even better predictors the further out they went.

Forecasting Trouble

So what are they showing as the FOMC’s year came to a close?

The Atlanta Fed’s sticky-price consumer price index (CPI)—a weighted basket of items that change price relatively slowly—rose 2.4 percent (on an annualized basis) in November, following a 3.6 percent increase in October. On a year-over-year basis, the series is up 3.8 percent.

On a core basis (excluding food and energy), the sticky-price index rose 2.4 percent (annualized) in November, and its 12-month percent change was 3.9 percent.

The year-over-year numbers are double the Fed’s “mandate.” 

While their “preferred” inflation gauge, the PCE index, is showing headline inflation around 2.3%, other measures like core CPI which hasn’t been below 3% since April 2021, suggest that things are still not under control. 

And considering the Atlanta Fed’s sticky forecasting tool, it may not be for a while.

We suppose that on occasion it may seem like we’re obsessed with predicting Armageddon. 

We cite sky-high stock valuations. 

We talk about the fact that the strength in the market has largely been driven by a handful of mega-tech/AI stocks. 

We point out economic realities (and the Fed interventions they prompt) that don’t support the case for a stampeding bull market. 

Our only goal in offering these observations is to make you, our readers, aware of the realities attached to the stock market (and to a larger degree, the economy). It’s important to know these things because we believe that you don’t always get the unvarnished truth (occasionally not even the “varnished” truth) from the mainstream.

For example…  A few months ago in August, the Bureau of Labor Statistics released its 2024 preliminary benchmark revision. 

Each year, the Current Employment Statistics (CES) survey employment estimates are benchmarked to comprehensive counts of employment for the month of March. These counts are derived from state unemployment insurance (UI) tax records that nearly all employers are required to file. For National CES employment series, the annual benchmark revisions over the last 10 years have averaged plus or minus one-tenth of one percent of total nonfarm employment. The preliminary estimate of the benchmark revision indicates an adjustment to March 2024 total nonfarm employment of -818,000 (-0.5 percent).

In plain English, once a year the BLS adjusts its jobs totals against state unemployment tax records (a more accurate number than their monthly guess). This past March the 12-month jobs number had to be revised down 818,000 jobs. That’s five times the average of the last 10 years. 

Things aren’t as rosy as they’ve been letting on.

In the reality of our financialized economy, this is business as usual. But that doesn’t mean you shouldn’t be aware of it.

So we point out the bad stuff. To make sure you have all the facts at your disposal. 

But that doesn’t mean we’re looking forward to the doom and gloom. The bigger reality is…

Stocks are a Bullish Phenomenon

The primary direction of the stock market is up!

In fact 80% of the time the market is in a bull trend. 

It’s always the corrections (“calamities”) that get the news coverage. But stocks, as a whole, have always come back. Let’s go back 40 years for an example…

In October 1987 the market experienced one of the most spectacular crashes in modern times. After putting in a rebound high on October 2, the market gave up roughly 35% of its value in just 12 days. (Actually, the majority of the crash came in only five days!)

S&P 500 – The October ‘87 Crash

Source: Barchart

It shook investors’ confidence for months. It led President Reagan to establish a group called the President’s Working Group on Financial Markets (known colloquially as the “Plunge Protection Team”).

But once the shock had worn off, the market started to rebound. And within two years, it had eclipsed its previous all-time high in 1987. (Meaning that those who were buyers during the bottoming period made somewhere around 50% on their money.)

Some declines (and subsequent rebounds) take longer than others. 

The tech wreck of 2000 — sparked by the “new paradigm” of paying multiples for companies with zero earnings — took the better part of two years to find its bottom. 

But it eventually did. 

Today the S&P 500 is 1,700% higher than its high in 1987… 

It’s 290% higher than its high in 2000…

It’s even 79% higher than its high in 2020…

Patience is the Thing

There’s a saying about the market that goes, “It’s better to be out when you want to be in, than to be in when you want to be out…”

Bear markets, especially those that happen in a hurry (i.e. crashes), can take their toll on investors’ nerves. 

And there’s always the question of how long before it resumes its upward path. (And relative to an investor’s cost basis (the price where you’re in the market) that can try an investor’s patience as well.) 

But given time, the market always rises. 

Legendary NYSE commentator Art Cashin once said…

“Never bet on the end of the world because that only happens once and something that happens once in infinity is a long shot.”

Our goal is to give you all the unvarnished info out there. 

But we’re not betting on the end of the world.

Here’s to a great 2025!

Seems like everything went right in 2024.

The S&P 500 spent the year making new all time highs soaring nearly 30% on the year.

After its major halving event (cutting rewards to miners) Bitcoin powered into the end of the year crashing through the $100,000 level. 

And in yet another Festivus feat of strength, the Nasdaq Composite (2,500 shares strong) blasted through the 20,000 level. 

In truth, much of this year’s performance in the stock market has been the result of the mega-cap sector: Those trillion dollar-plus market cap companies heavily involved in the AI boom. If you factor out their weighting in the S&P 500, the index’s performance on the year is cut by about half. (It’s only up about 15% which is more in line with the small-cap Russell 2000 has done.)

But alternate measures aside, the AI sector is booming and appears it will keep booming for the foreseeable future.

This week’s stock spotlight is on one of those drivers.

The Boom in Broadcom

Broadcom Inc. (AVGO) is one of the tech stocks that’s muscling its way into the Mag-level club having just eclipsed $1 trillion in market cap.

Broadcom is involved in both the semiconductor industry as well as infrastructure software — namely software in the cloud computing biz.

Last week, AVGO released its fourth quarter earnings. CNBC reported:

Broadcom reported better-than-expected fourth-quarter earnings on Thursday and said artificial intelligence revenue for the year more than tripled.

AI revenue had reached $6 billion from less than $2 billion at the beginning of the year.

Add to that the fact that revenue from its chips segment also grew 12% year-over-year and you’ve got a damn hot stock. 

Broadcom Inc. (AVGO) YTD

Source: Barchart.com

The market literally stampeded on board. And this is no doubt excellent news for the company. 

But there are two things investors should take note of.

First, you can see a similar gap higher back during its June earnings release. Prices followed through for a couple sessions, but then consolidated over 20% lower, testing the stock’s 200-day moving average. 

The other thing you’d want to look at is the company’s valuation at current levels. At these post-gap prices, shares are trading at a P/E of 195. (That means you’re paying $195 for every $1 of earnings.)

A lot of tech companies have gotten pretty heady in the past. But things have settled to more realistic valuations. META’s P/E is only around 29. MSFT is only 36. Even the big dog in the AI pack — NVDA — is only sporting a P/E of 53.

Broadcom has moved into some lofty valuations.

And while the future may be bright for this newly minted $1 trillion behemoth, investors might do well to exercise some patience when looking at it.

“All the Whos down in Whoville liked Christmas a lot. 

But the Grinch, who lived just north of Whoville, did not!”

– Dr. Seuss

The annual holiday classic, that we’ve all seen a million times, tells the story of a nasty green cave dweller who tries to stop Christmas. 

Despite the fact he eventually learns the true meaning of Christmas and saves the day, his name has become synonymous with being cynical or mean-spirited.

Well, since the holiday season is at hand, we want to say up front that we really don’t mean to be a Grinch about the markets.

But given we feel it’s our duty to show our readers the unvarnished investing truth, here’s a development you need to know…

Recalling the “Value Master”

A couple weeks back, we took note of the fact that none other than Warren Buffett — mister buy and die — had become a net seller in the stock market.

Buffett, who still actively manages Berkshires’ portfolio, has been a net seller of stocks for the past eight quarters, significantly rearranging his portfolio. …

Add it all up and Buffett has raised Berkshire’s cash position to $320 billion versus just $272 billion in stocks.

We speculated on the reasons for this notable shift in sentiment:

Is the Oracle calling a top? It’s certainly not impossible. Buffett is the king of buying value — great companies fairly priced. If valuations are exceeding what he deems reasonable, he may be building a cash store to take advantage of a major correction.

We also noted that Buffett is not a market timer. So the fact that he’s unloading now doesn’t suggest that anything is imminent.  Better to be out when you want to be in instead of in when you want to be out.

But given our speculation, we found a recent analysis of the market’s overall valuation to be worth noting. But first…

A Little Primer On Valuation

When you buy a stock, you’re basically buying a piece of the company’s expected future earnings. And the price you pay today should reflect a discounted value of that. So in basic terms, price should be a fair reflection of value. But that’s not always the case.

Comparing the price of a company’s stock to its earnings (price-earnings or P/E ratio) is the most common way of establishing valuation. Below is an historical chart of the P/E ratio of the S&P 500:

Source: LongtermTrends.net

You can see that for over 100 years, valuations basically oscillated around the long-term mean with a dip 50% below indicating undervalued and rise to 50% above indicating overvalued. Then, however, came the tech bubble and valuations became both extreme and extremely volatile.

Another, more smoothed measure, is known as the cyclically-adjusted price-earnings (CAPE) ratio. (It’s also known as the Shiller PE Ratio for the economist Robert Shiller who invented it.) This ratio measures price to earnings except instead of using a single year of earnings, it uses average real earnings over a 10-year period. This smooths out volatility as a result of business cycles. 

Source: LongtermTrends.net

You can see this measure smoothed things out considerably leaving only two overvaluation spikes: before the crash of 1929 and the bust that followed the tech bubble… until today.

Today valuations according to the Shiller ratio are at their second highest levels in history. 

But there’s yet one more level of smoothing that can be done…

It comes from Damien Cleusix of QuantasticWorld and it’s called the margin-adjusted, cyclically-adjusted price-earning ratio (MAPE)

MAPE factors in and adjusts for the level of profit margins embedded in the valuation calculation.  
And by this measure the market isn’t just overvalued… It’s insanely overvalued.  According to Cleusix “the US stock market is the most overvalued it has ever been.”

Source: Quantasticworld

Looking at this chart, the sky-high valuations (the level traced in green) are obvious.  Further, if you construct a band with boundaries between the 0 and 50 percentiles of historical MAPE, this is what you get:

Source: Quantasticworld

According to Cleusix:

The S&P 500 is currently almost 400% above the level corresponding to a bottom MAPE and 130% above the 50% percentile MAPE history.

Valuations at the high end of any measure suggest that an investment is “priced for perfection” — that earnings and growth will continue ad infinitum. And that leaves the door open for any kind of disappointment to send prices plummeting back to more “reasonable” valuations.

Like we said, we don’t want to be Grinchy this close to the holidays. But being aware of the potential threats to the market (and the bad news that could result) is the key to actually having a merrier Christmas!

The Fed has officially embarked on its quest for the holy grail of monetary policy… 

Having slain the inflation monster with restrictive rates of 5.5% (or so they say) they must now start easing off the brakes so the rest of the economy doesn’t sputter and die.

The problem is, as Chairman Powell has admitted over and over, they have no idea what “neutral” actually is. (But they assure us, they’ll know it when they see it.)

And despite not knowing where they’re headed, they launched their effort by slashing their target rate by 50 basis points. Pretty much as large as they could go without sparking some panic in the market. 

The market, which had been in a solid uptrend since the low in October 2022, driven largely by mega-cap AI stocks, celebrated by continuing its rally. 

This policy reversal by the Fed is something the market has been anticipating for some time. And now that the easing cycle is underway, it should continue to please those big players driving the market.

But it should also benefit another segment of the market that has been lagging. And that creates an opportunity for investors…

Rise of the Small Caps

Since the low in October 2022, small cap companies have lagged the bigger players in the market. Take a look at the chart below…

S&P 500 vs Russell 2000

Source: Barchart

You can see tightly related performance of both the S&P 500 (an index dominated by mega-cap companies) and the Russell 2000 (an index of small-cap companies) into the 2022 low. 

Once mega-AI stocks began to drive the rally, the bigger better capitalized stocks took off. Smaller cap stocks, on the other hand, struggled to keep up lagging by over 20%.

That’s one sector that had been significantly impacted by the Fed’s tightening cycle. Now that’s very likely to change.

Why Small-Caps Love Lower Rates

Small cap companies are typically more sensitive to interest rates. One reason is that they tend to be more reliant on external financing to fund their operations and growth. 

Huge companies like Alphabet, Amazon, Microsoft all have massive cash reserves they can fall back on to fund their strategic plans. Tens of billions have been spent by big tech from their war chests on AI development. 

But many smaller companies, companies with market caps in the lower billion dollar range, don’t have that kind of financial ammo. They have to keep their eyes on operations. That means strategic borrowing is much more critical when it comes to things like financing growth and innovation.

Another reason is bottom line profitability. 

Smaller-cap companies generally have smaller profit margins than their bigger capitalized cousins. And a higher cost of capital (what they pay to borrow) tends to take a significant bite out of their already-thin bottom line.  

With the Fed moving to ease, lower financing costs will ultimately boost many small-cap companies’ bottom lines making them more profitable companies.

And of course, that leads to a third factor in bolstering the fortunes of the small-cap crowd — more profitable companies are more attractive to investors.

Lower interest rates, from an investor perspective, tends to generate what’s known as a “risk on” investment environment. One where funds and other institutional investors will leverage their portfolios by borrowing money to invest in companies they feel have potential for significant returns. 

And companies that have the potential for significant returns? Well they’re generally the ones that are undervalued or have been lagging the broader market. 

Right now, that’s the small cap sector. 

Looking at the chart above, the small-cap sector as a whole has significant room to actually outperform larger-cap competitors. 

Some small caps will do better than others. But right now may be the time for savvy investors to start scanning the small-cap universe for significant opportunities.

What a week for tech stocks. 

A sci-fi-level technology known as “quantum computing” is fast becoming a reality, and certain stocks in the field have seen explosive gains in the last week.

Quantum computing is based on the science of quantum mechanics — a theory in physics that deals with our world at the subatomic level. And things at the subatomic level operate a little differently than we understand them.

Where bits in the observable world are only 0’s or 1’s, bits in the quantum world (also known as “qubits”) can be 0’s, 1’s or 0’s and 1’s simultaneously.

If that concept makes your head spin, don’t worry about it; you don’t have to completely understand a new technology to potentially make a ton of money investing in it.

You can bet that most early IBM investors didn’t know exactly how its revolutionary, world-changing microprocessor technology worked … but those investors were able to see extraordinary gains as computing took over the world.

This new quantum computing tech has the same world-changing potential (maybe even more) as the microprocessor — and this rapidly developing technology is leading to some exciting opportunities for investors.

Here are three ways to play the trend … plus one bonus “sleeper” play for investors looking for aggressive growth potential.

Quantum Play #1: The 800-Pound Gorilla

For investors interested in doing some more due diligence in the area of quantum computing, here are three places to look for opportunity.

For those looking for the safest play in this up and coming field, look no further than Google (GOOG).

Google has been at the leading edge of quantum computing for years. And recently they just announced a major breakthrough in their technology.

Source: Nature

One of the challenges that comes with this new quantum tech is the ability to scale it. Adding more and more qubits to a process increases the number of errors that are likely to occur. (This has been a challenge in the field since 1995.)

It appears that Google has finally designed a breakthrough with its latest quantum processor known as Willow. According to an article in Nature Magazine…

Researchers at Google have built a chip that has enabled them to demonstrate the first ‘below threshold’ quantum calculations — a key milestone in the quest to build quantum computers that are accurate enough to be useful.

“Below threshold” calculations drive the number of errors down, while scaling up the number of qubits processed.

According to a recent blog post by Hartmut Neven, the founder of Google Quantum AI:

Willow performed a standard benchmark computation in under five minutes that would take one of today’s fastest supercomputers 10 septillion (that is, 1025) years — a number that vastly exceeds the age of the Universe.

You read that right. Willow did in five minutes what it would take the most advanced supercomputer today 10,000,000,000,000,000,000,000,000 years to do.

And it did it while reducing the number of errors that occurred.

Needless to say, this is a HUGE breakthrough for Google.

Quantum Play #2: Leveraging Light Waves

For those looking for a more aggressive play, look no further than what’s becoming the hottest quantum stock in the market today… Quantum Computing Inc. (QUBT).

While Google is busy scaling, QCi has been attempting to carve out its own niche in the quantum field using a technology known as thin-film lithium niobate (TFLN) chips that leverage nonlinear quantum optics.

That’s a mouthful, but what it basically means is that QCi’s technology uses light to generate qubits. Where a computer today can only understand bits where a light is on or off, qubits generated from light can act like a dimmer switch. They can be on, off or anything in between. Nonlinear quantum optics is the science that allows their technology to create and work with these qubits.

While the company is relatively small — its market cap is only around $2 billion — it has recently announced multiple orders for their tech.

The first came from an unnamed “prominent research and technology institute based in Asia.”  A week later they announced a second purchase order from the University of Texas at Austin.

And even more recently…

Source: PR Newswire

While the specifics of the orders weren’t completely clear in the press releases, the company’s share price exploded over 1,100% in the last month on the news.

Quantum Play #3: The Wild Card

Investors interested in more of a pure quantum play could look into Rigetti Computing (NASDAQ: RGTI).

The California-based quantum computing pioneer had a lot to be thankful for in late November as its stock popped following news that it had raised $100 million in a direct offering.

And that wasn’t the only good news coming out of Rigetti this year. It also announced that it had installed a 24-qubit quantum computer in the UK’s National Quantum Computing Centre.

As of this writing, the company’s stock is up more than 928.85% over the last 6 months, but analysts are mixed as to whether Rigetti is hitting a roof or if the company still has room to grow.

But with $100.5 million in cash reserves, growing partnerships worldwide, and fresh interest in its industry-leading quantum services, Rigetti could make a very compelling investment opportunity for the right investor.

Bonus Play: The Quantum “Sleeper”

Finally, if you’re an investor with a bit more risk appetite looking for an under-the-radar small-cap company that’s targeting a critical area in the quantum field, you might want to investigate Scope Technologies Corp. (OTCQB: SCPCF; CSE: SCPE).

Scope Technologies is a Canadian-based company that has developed, among other things, quantum-proof encryption technology.

This is no small area when it comes to the prospects of quantum computing. The prospect of calculating at quantum speeds offers the potential for amazing benefits. But it also brings with it the potential for enormous threats.

Consider what Google’s Willow chip just did — it performed a benchmark calculation in five minutes that an advanced supercomputer would take 10 septillion years to do.

Now think of that in terms of today’s computer security.

Cybersecurity company Hive Systems created a table estimating how long it would take a sophisticated hacker today to crack passwords of various lengths and complexities…

Source: Tech.com

The bottom right corner shows the strongest password combination would take roughly 26 trillion years to beat.

That’s probably two-and-a-half minutes in Willow’s quantum time.

As the power of quantum computing becomes more and more mainstream, the need for equally powerful cyber defenses will skyrocket.

Streetlight Confidential Senior Editor Tim Collins has put together an in depth research report on the topic that you can access here.

Scope Technologies is a small firm — only about $45 million as of this writing — and, unlike the other stocks listed above, its stock hasn’t seen a ton of upward momentum yet. But the company has great potential in an area that will be more and more critical as this technology evolves.

AI may be the tech darling of the day, the future of tech (and investors’ bottom lines) is shaping up to be in the quantum realm.

Washouts happen.

But ultimately they can be for the good. 

Take Cisco Systems. 

Back during the 90s tech boom, Cisco exploded becoming priced so far ahead of its earnings, that after it got its bubble comeuppance it never regained its previous highs. Still, the company bounced back, grew steadily and in early 2011 began paying a dividend. It went from being a superstar growth stock to a reliable dividend payer.

Cisco Systems (CSCO)

Source: Barchart.com

And while the company still hasn’t rebounded all the way to its all-time high, it has experienced a solid bullish trend from its lows. 

Cisco is now a good stock to own.

Today, another of the pandemic darlings may be getting ready to rise from the ashes.

Is Zoom Ready to Boom Again?

Zoom Communications (ZM) — formerly Zoom Video Communications (more on that in a second) — could be repositioning itself to a similar end. 

During its pandemic heyday, it was adopted as a major growth stock — a company with massive growth potential. It traded from an IPO value of around $63 to a staggering $550-plus in a matter of months.

A little too far out over its skis, the company crashed back to reality. 

These days, however, the company has been performing well financially. Its most recent earnings report saw the company beat estimates on both earnings per share ($1.38 vs. $1.31 estimated) and revenue ($1.18 billion vs. $1.16 billion).

Its bottom line numbers also showed some significant improvement as well: $207.1 million up from $141.2 million in the same quarter a year earlier. 

Surprisingly, the stock sold off on the news.

But the company recently announced a major shift in its business direction. It dropped the word “Video” from its company name to signal its expansion into the field of AI.

In reaction, the company is introducing a number of artificial intelligence (AI) features. It recently unveiled its AI-first Work Platform designed to help enhance interaction and productivity through AI tools. This includes its Zoom AI Companion 2.0, an AI assistant that can perform tasks such as summarizing conversations, identifying action items, and helping compose messages.

And the company has plans to introduce more AI-driven features, designed to target specific industries.

Leveraging AI functionality in their software could be a critical move in an age of exponentially growing digital data. 

Zoom Communications (ZM)

Source: Barchart.com

While it may never see its lofty all-time highs again, Zoom could be rebuilding for a Cisco-style comeback. 

And it may now be a stock worth watching…