The bogeyman of AI stocks has been summoned.

In late January, Chinese artificial intelligence company DeepSeek released an open source Large Language Model rivaling OpenAI’s ChatGPT, Google’s Gemini and Meta’s Llama.

The LLM, which was supposedly developed in only a few months with a budget under $6 million, is significantly more efficient than competitors and, consequently, 20 to 50 times cheaper to use than OpenAI’s o1 model.

The stock market’s reaction to the DeepSeek release was immediate, and, for a hot minute, there was blood in the streets on stocks even tangentially related to AI.

Source: Barchart.com

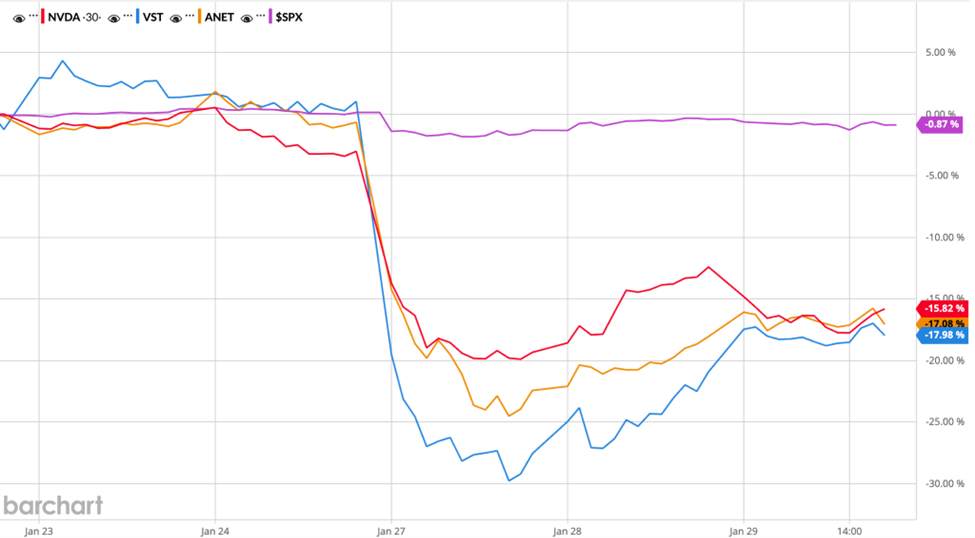
Tech darling Nvidia’s (NASDAQ: NVDA) shares plummeted nearly 18%, marking the largest single-day loss in its history and setting a new record for the biggest one-day loss for a single company in U.S. stock market history, erasing approximately $465 billion from Nvidia’s market cap.

The day’s other big losers included Vistra Corp (NYSE: VST), an electricity generation conglomerate with significant nuclear power holdings, and Arista Networks (NYSE: ANET), a purveyor of (among other things) cloud networking services for large AI data centers.

As if that wasn’t enough for the poor, beleaguered markets …

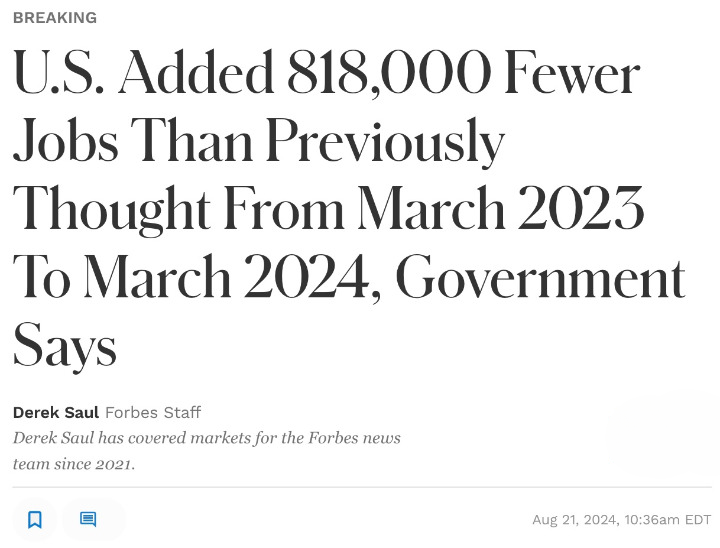
… after a small bounce back, additional volatility hit the market later that week as President Trump announced tariffs on trade with Mexico, Canada and China.

The tariff threat was later rolled back (for now) … but many retail investors are still reeling from the amount of uncertainty injected into the markets in a relatively short period.

So what’s the best way to take advantage of the trend?

3 Ways to Play a Crazy Market

If you’re looking to protect your portfolio while still capturing upside, you have a few options.

1. Defend

When markets get choppy, stable, dividend-paying stocks could help smooth out the ride.

Companies that sell essential products or services like food, beverages, and personal products tend to weather stock-market hurricanes with a reassuring stability.

Johnson & Johnson (NYSE: JNJ) is a classic example. With its mix of pharmaceuticals, medical devices, and consumer health products, JNJ has reliably provided investors with a port in the storm for decades.

Plus, with a 3% dividend yield and a low beta of 0.55, it provides reliable income and lower volatility — an excellent safe harbor in turbulent times.

Another “classic” example would be one of Warren Buffett’s favorite investments — Coca-Cola (NYSE: KO). This beverage behemoth has provided Buffett with stunning returns in the vicinity of 2,437% over the last few decades … while providing up to $700 million in dividends annually.

Source: Barchart.com

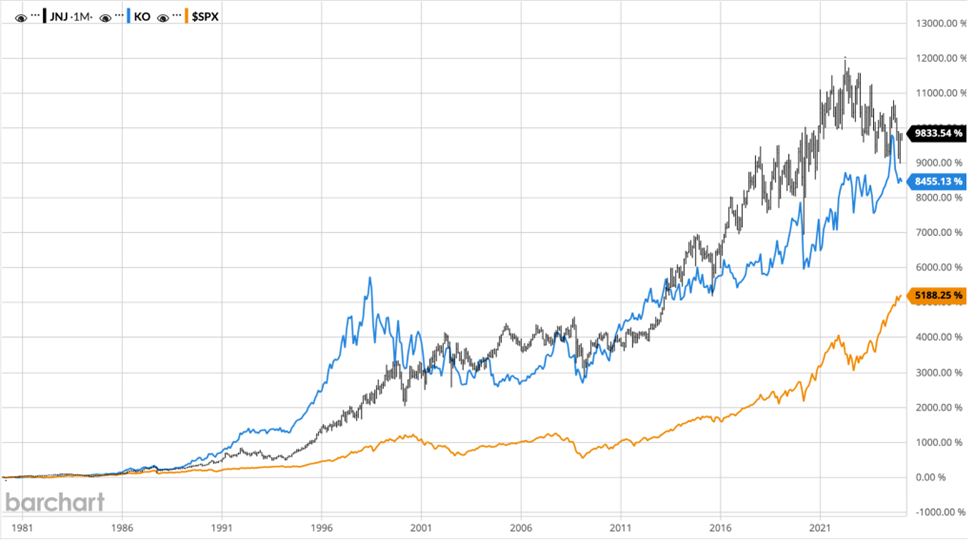
Neither stock dramatically outperforms the S&P until you zoom your chart out to 30+ years … but then again, the S&P doesn’t pay dividends. 

If you are looking for longer-term, reasonably reliable gains while also receiving an income from dividends, playing “defense” could be a good strategy for your portfolio.

2. Parry

In fencing terms, a “parry” is a move that both defends and sets up for an attack … and that might be just the right move for a certain type of investor when the market’s going nuts.

This type of investor might consider using that volatility to their advantage by “buying the dip” when a high performing stock with solid fundamentals suddenly lurches downward.

In the DeepSeek panic noted above, several solid companies plunged more than 15% … but a few days later two of the three had rebounded as much as 20% from trough to peak.

Investors who kept their wits about them during the chaos of trading on January 28 had the opportunity to pick up some well performing, large cap stocks at a pretty decent discount and see an immediate ROI.

This is a more aggressive play, so be cautious as you are doing your due diligence on a potential investment; more than one investor has bled trying to catch a falling knife.

3. Attack

The most aggressive play — the high risk, high reward option — is to lean into the volatility and try to seek out an aggressive growth stock in the sector that’s primed to deliver outsized returns.

For example, President Trump’s outspoken desire to unleash American energy as a tool for American prosperity has the potential to dramatically affect the domestic oil and gas landscape.

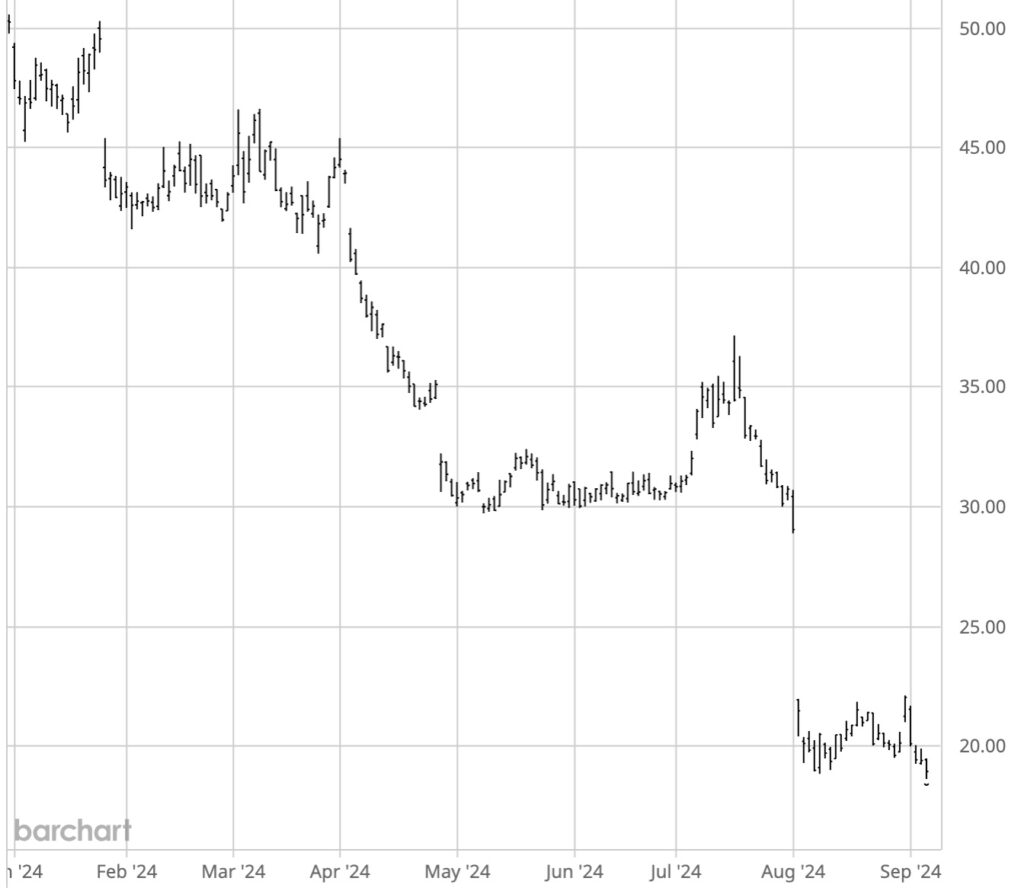
His “Drill, baby, drill!” rhetoric hasn’t yet moved the needle for major producers like Chevron (NYSE: CVX), Occidental Petroleum (NASDAQ: OXY) or ExxonMobile (XOM) … but some smaller producers like Prairie Operating Co. (NASDAQ: PROP) have seen dramatic double-digit stock growth over the last month.

Source: Barchart.com

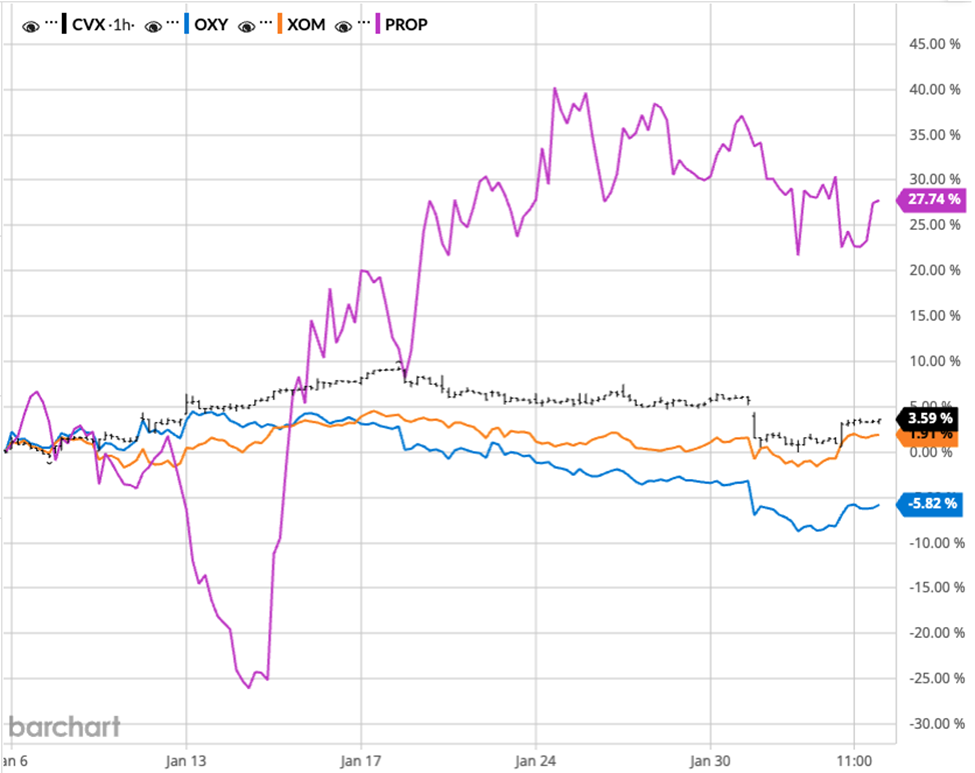
The growth isn’t the only thing dramatic about Prairie’s chart. The more observant readers will notice that the swings between company’s peaks and troughs are significantly larger than the bigger producers … but in that volatility lies the potential for what could be explosive growth.

Warning: Math Ahead

As of this writing, the stock is sitting around $8.60 with a $197.38 million market cap. The company released a 2025 EBITDA forecast between $100 million and $140 million and capex estimated at roughly $100 million for 2025. Additionally, the company has relatively low debt.

Based on a valuation formula called the Enterprise Multiple, some back-of-the-napkin math indicates that the company is currently trading at a 1.58x-2.21x multiple.

What does this mean?

It suggests that PROP is potentially undervalued compared to its peers — trading at a relatively low multiple compared to the broader oil and gas industry, which typically sees EV/EBITDA multiples between 4x and 8x.

If the company’s stock starts trading more in line with the industry average, the market cap could shoot up anywhere between $396 million to $1.096 billion.

That’s a huge range … and it’s not guaranteed that Prairie will ever hit those lofty heights.

But with Trump shouting from the rooftops that American energy is going to see a renaissance … this company could potentially be an aggressive investor’s vehicle to fairly significant returns.

The bottom line?

No matter how you choose to play market turmoil — defend, parry or attack — volatility isn’t necessarily something to fear …

… It’s something you could potentially profit from.

Make a plan, do your due diligence, then execute.

We suppose that on occasion it may seem like we’re obsessed with predicting Armageddon. 

We cite sky-high stock valuations. 

We talk about the fact that the strength in the market has largely been driven by a handful of mega-tech/AI stocks. 

We point out economic realities (and the Fed interventions they prompt) that don’t support the case for a stampeding bull market. 

Our only goal in offering these observations is to make you, our readers, aware of the realities attached to the stock market (and to a larger degree, the economy). It’s important to know these things because we believe that you don’t always get the unvarnished truth (occasionally not even the “varnished” truth) from the mainstream.

For example…  A few months ago in August, the Bureau of Labor Statistics released its 2024 preliminary benchmark revision. 

Each year, the Current Employment Statistics (CES) survey employment estimates are benchmarked to comprehensive counts of employment for the month of March. These counts are derived from state unemployment insurance (UI) tax records that nearly all employers are required to file. For National CES employment series, the annual benchmark revisions over the last 10 years have averaged plus or minus one-tenth of one percent of total nonfarm employment. The preliminary estimate of the benchmark revision indicates an adjustment to March 2024 total nonfarm employment of -818,000 (-0.5 percent).

In plain English, once a year the BLS adjusts its jobs totals against state unemployment tax records (a more accurate number than their monthly guess). This past March the 12-month jobs number had to be revised down 818,000 jobs. That’s five times the average of the last 10 years. 

Things aren’t as rosy as they’ve been letting on.

In the reality of our financialized economy, this is business as usual. But that doesn’t mean you shouldn’t be aware of it.

So we point out the bad stuff. To make sure you have all the facts at your disposal. 

But that doesn’t mean we’re looking forward to the doom and gloom. The bigger reality is…

Stocks are a Bullish Phenomenon

The primary direction of the stock market is up!

In fact 80% of the time the market is in a bull trend. 

It’s always the corrections (“calamities”) that get the news coverage. But stocks, as a whole, have always come back. Let’s go back 40 years for an example…

In October 1987 the market experienced one of the most spectacular crashes in modern times. After putting in a rebound high on October 2, the market gave up roughly 35% of its value in just 12 days. (Actually, the majority of the crash came in only five days!)

S&P 500 – The October ‘87 Crash

Source: Barchart

It shook investors’ confidence for months. It led President Reagan to establish a group called the President’s Working Group on Financial Markets (known colloquially as the “Plunge Protection Team”).

But once the shock had worn off, the market started to rebound. And within two years, it had eclipsed its previous all-time high in 1987. (Meaning that those who were buyers during the bottoming period made somewhere around 50% on their money.)

Some declines (and subsequent rebounds) take longer than others. 

The tech wreck of 2000 — sparked by the “new paradigm” of paying multiples for companies with zero earnings — took the better part of two years to find its bottom. 

But it eventually did. 

Today the S&P 500 is 1,700% higher than its high in 1987… 

It’s 290% higher than its high in 2000…

It’s even 79% higher than its high in 2020…

Patience is the Thing

There’s a saying about the market that goes, “It’s better to be out when you want to be in, than to be in when you want to be out…”

Bear markets, especially those that happen in a hurry (i.e. crashes), can take their toll on investors’ nerves. 

And there’s always the question of how long before it resumes its upward path. (And relative to an investor’s cost basis (the price where you’re in the market) that can try an investor’s patience as well.) 

But given time, the market always rises. 

Legendary NYSE commentator Art Cashin once said…

“Never bet on the end of the world because that only happens once and something that happens once in infinity is a long shot.”

Our goal is to give you all the unvarnished info out there. 

But we’re not betting on the end of the world.

Here’s to a great 2025!

“All the Whos down in Whoville liked Christmas a lot. 

But the Grinch, who lived just north of Whoville, did not!”

– Dr. Seuss

The annual holiday classic, that we’ve all seen a million times, tells the story of a nasty green cave dweller who tries to stop Christmas. 

Despite the fact he eventually learns the true meaning of Christmas and saves the day, his name has become synonymous with being cynical or mean-spirited.

Well, since the holiday season is at hand, we want to say up front that we really don’t mean to be a Grinch about the markets.

But given we feel it’s our duty to show our readers the unvarnished investing truth, here’s a development you need to know…

Recalling the “Value Master”

A couple weeks back, we took note of the fact that none other than Warren Buffett — mister buy and die — had become a net seller in the stock market.

Buffett, who still actively manages Berkshires’ portfolio, has been a net seller of stocks for the past eight quarters, significantly rearranging his portfolio. …

Add it all up and Buffett has raised Berkshire’s cash position to $320 billion versus just $272 billion in stocks.

We speculated on the reasons for this notable shift in sentiment:

Is the Oracle calling a top? It’s certainly not impossible. Buffett is the king of buying value — great companies fairly priced. If valuations are exceeding what he deems reasonable, he may be building a cash store to take advantage of a major correction.

We also noted that Buffett is not a market timer. So the fact that he’s unloading now doesn’t suggest that anything is imminent.  Better to be out when you want to be in instead of in when you want to be out.

But given our speculation, we found a recent analysis of the market’s overall valuation to be worth noting. But first…

A Little Primer On Valuation

When you buy a stock, you’re basically buying a piece of the company’s expected future earnings. And the price you pay today should reflect a discounted value of that. So in basic terms, price should be a fair reflection of value. But that’s not always the case.

Comparing the price of a company’s stock to its earnings (price-earnings or P/E ratio) is the most common way of establishing valuation. Below is an historical chart of the P/E ratio of the S&P 500:

Source: LongtermTrends.net

You can see that for over 100 years, valuations basically oscillated around the long-term mean with a dip 50% below indicating undervalued and rise to 50% above indicating overvalued. Then, however, came the tech bubble and valuations became both extreme and extremely volatile.

Another, more smoothed measure, is known as the cyclically-adjusted price-earnings (CAPE) ratio. (It’s also known as the Shiller PE Ratio for the economist Robert Shiller who invented it.) This ratio measures price to earnings except instead of using a single year of earnings, it uses average real earnings over a 10-year period. This smooths out volatility as a result of business cycles. 

Source: LongtermTrends.net

You can see this measure smoothed things out considerably leaving only two overvaluation spikes: before the crash of 1929 and the bust that followed the tech bubble… until today.

Today valuations according to the Shiller ratio are at their second highest levels in history. 

But there’s yet one more level of smoothing that can be done…

It comes from Damien Cleusix of QuantasticWorld and it’s called the margin-adjusted, cyclically-adjusted price-earning ratio (MAPE)

MAPE factors in and adjusts for the level of profit margins embedded in the valuation calculation.  
And by this measure the market isn’t just overvalued… It’s insanely overvalued.  According to Cleusix “the US stock market is the most overvalued it has ever been.”

Source: Quantasticworld

Looking at this chart, the sky-high valuations (the level traced in green) are obvious.  Further, if you construct a band with boundaries between the 0 and 50 percentiles of historical MAPE, this is what you get:

Source: Quantasticworld

According to Cleusix:

The S&P 500 is currently almost 400% above the level corresponding to a bottom MAPE and 130% above the 50% percentile MAPE history.

Valuations at the high end of any measure suggest that an investment is “priced for perfection” — that earnings and growth will continue ad infinitum. And that leaves the door open for any kind of disappointment to send prices plummeting back to more “reasonable” valuations.

Like we said, we don’t want to be Grinchy this close to the holidays. But being aware of the potential threats to the market (and the bad news that could result) is the key to actually having a merrier Christmas!

The US consumer is the bedrock of our economy. 

If that’s truly the case — (and it is) — then signals are flashing everywhere that the economy is headed for trouble. 

Case in point…

Source: ZeroHedge

The Tylers over at ZeroHedge reported:

Bloomberg Intelligence’s Joel Levington published a new report Monday, citing new data from CarEdge that showed a staggering 39% of vehicles financed since 2022 carry negative equity, including 46% of EVs

What this basically means is that balances on people’s auto loans are more than the value of the vehicle they’re paying on. 

Now falling car values shouldn’t come as a surprise to anyone. 

A car is not an asset in any “investment” sense of the word. It’s a means of transportation.

In the world of business, vehicles are recognized as “depreciating assets” (over the “useful life” of the vehicle) on a business’ taxes. They have a tax-reducing effect on their bottom line. 

Depreciation refers to the decrease in value of long-term assets over time. Depreciation is spread over the useful life of the asset and is intended to realistically reflect the actual value of the asset and the profit. Furthermore, it is designed to have a tax-reducing effect. Depreciation of vehicles is done on a linear basis, meaning the vehicle’s value is evenly spread over its useful life. The vehicle’s useful life plays a crucial role in this process. The amount of depreciation depends on the purchase price and the vehicle’s useful life.

There’s a maxim that says cars depreciate by over 10% the minute you drive it off the dealer’s lot. So you’re pretty much starting in the hole.

So, again, the fact that the value of American’s cars are falling shouldn’t be any surprise. What is troubling is the fact that consumers still owe so much on their vehicles.

Consumers Are Sinking Fast

The Federal Reserve just reported that the average finance charge for a new car in Q3 2024 was 8.76%! But that’s not the really shocking part. What really catches your attention is that’s the rate being charged for a 72 month loan! 

Six years to pay off a car? Not long ago four years was pretty much the financing limit.

The problem stems from a combination of factors.

Back during the pandemic stimulus spree, the extra free money (not to mention the near zero financing cost) at the time made trading in the old car seem like a good idea. 

The stampede to the local car dealer (along with the supply fiasco) drove new car prices through the roof. 

Source: Federal Reserve Bank of St. Louis

After some 20-plus years of relative price stability in the new car market, prices exploded by over 20% in a span of three years thanks to all the “free” money.

Today, thanks to the sharply higher prices, auto loan balances rose by $18 billion in the last quarter alone, and now stand at $1.64 trillion — the highest category of non-housing debt.

These unaffordable prices are what’s behind the longer and longer financing terms. 

Further according to Experian 33% of monthly car payments stand between $500-$700 per month. And, hold on to your hats, over 16% are over $1,000.

This would be fine if everyone could afford it. But 90-plus day delinquency rates on auto loans just upticked again to 4.6%. (Which might not seem bad compared to credit card delinquencies which have reached 11.1%!)

There’s an idea floating around that the economy is doing just fine. 

But when you look past the headlines (and you don’t have to look far) you can see the strains building.

It accounts for 70% of the country’s GDP.

Consumer spending. 

Makes sense. Healthy consumers are obviously necessary for a healthy economy. 

But good health isn’t always apparent on the surface. Trouble can be quietly developing under the surface.

Like the heart disease candidate whose arteries are filling with plaque. They may look perfectly fine… until they’re lying on the ground clutching their chest. 

Today’s economy is something like that.

Last October, the BEA announced that real GDP rose at an annualized rate of 2.8%.

That is an impressive number. 

To take it at face value (much like the Fed has been insisting we do) you’d have to say that the economy, and consumers in particular, are doing just fine. So have another piece of cheesecake.

The reality underlying the situation, however, isn’t so good.

A Shift in Buying Preference 

In a broadly healthy economy, a rising GDP should lift all boats. (Or most anyway.) You expect to see retailers posting great numbers across the board. Blood is pumping through those arteries. 

But that’s not what has been happening. And it hasn’t been happening for some time…

All the way back in November 2022, the Wall Street Journal reported:

Source: The Wall Street Journal

“Walmart gains more shoppers” sounds like good news. But article reported strains in the consumer sector:

The country’s largest retailer by revenue said Tuesday that households continue to face pressure from rising food prices, and lower-income shoppers are eating into savings.

Inflation was still roaring at the time and CPI for that month came in at 7.1%. And you’d expect that kind of news from lower-income shoppers. But what you might not expect…

During the most recent quarter, households earning $100,000 or more helped push Walmart grocery sales higher, executives said.

Sales data had indicated that higher-income consumers had begun to trade down searching for bargains. When inflation begins to reach the middle to upper income brackets, stress is beginning to build. 

Still, with prices soaring over 7% annually, it’d be reasonable to argue that most households would be looking to save a buck or two.

But now with inflation “well on track back to 2%,” if you believe the Fed, things should be shifting back to normal. But they’re not.

In fact, they’re going in the opposite direction…

The Trade Down Continues

This November Walmart released its earnings. Not only did they beat revenue and earnings estimates, they raised their forward guidance. 

In particular, management noted…

While average transaction growth slowed, customers are buying more at each visit, driving ticket sizes. A lot of that growth was driven by upper-income households making $100,000 a year or more as increasingly more affluent households trade down. That cohort made up roughly 75% of share gains for the quarter.

Two years later, the $100K and up cohort is still shopping at Walmart. And they’re doing it more and more. 

This suggests clear strains in the economy. In a recent webinar, Goldman Sachs noted:

Our focus on the webinar centers around discussing high-end and low-end consumers trading down. This phenomenon occurs as macroeconomic headwinds mount, including elevated inflation and high interest rates due to backfiring ‘Bidenomics.’ More importantly, trading down occurs when incomes don’t keep up with inflation or when purchasing power decreases.

So the trade down phenomenon itself is suggesting trouble. But there’s more…

The bargain hunting isn’t carrying across the board. 

Target, who released their earnings the same day as Walmart, missed everywhere with their stock dropping 21% on the news. 

This suggests that the trade down to discount stores isn’t even widespread. (Even Dollar General collapsed on its latest earnings report.)

The bottom line: The trade down and concentration of retail customers suggests they’re taking a seriously defensive position as economic conditions become more and more uncertain.

Could be tough times ahead. 

There’s something to be said for government investments…

They’re stupid.

Nearly every foray into industrial policy by a government ends up creating serious unintended consequences.

But that doesn’t mean they’ll stop trying.

This latest government go-round involving the tech industry will likely be no different.

Launching a Giveaway Program

Quick story… When global governments shut down the world during the pandemic, the US became painfully aware of just how dependent its economy was on foreign production of certain key materials. One notable dependency was in the semiconductor segment.

The shortage that followed sent shockwaves through multiple industries that relied on access to these tech components.

In the face of this realization, the government did what it does best.

It threw money at the problem.

In 2022 the Biden Administration (in cahoots with the US Congress) passed something called the Chips Act. The White House assured us that this $280 billion handout would:

…accelerate the manufacturing of semiconductors in America, lowering prices on everything from cars to dishwashers. It also will create jobs – good-paying jobs right here in the United States.  It will mean more resilient American supply chains, so we are never so reliant on foreign countries for the critical technologies that we need for American consumers and national security.

In addition to targeting semiconductor manufacturing capability in the US, it would fund R&D in various “leading edge” technologies. (In other words, technologies that don’t have a viable commercial market of their own.)

One of the first to step up to the trough was the former heavyweight champion of the chip industry — Intel.

Source: CNBC

According to the article:

Intel said it would spend its CHIPS Act funds on fabs and research centers in Arizona, Ohio, New Mexico and Oregon. The company previously announced plans to spend $100 billion on U.S. programs and facilities. Intel has announced a plan to catch up in leading-edge manufacturing by 2026.

Intel’s Ohio fab will cost more than $20 billion and Intel said it is expected to start production in 2027 or 2028. Intel is also expanding manufacturing operations in Arizona and New Mexico. Intel says the projects will create jobs for 20,000 people in fab construction and 10,000 people in chip manufacturing.

The company’s stock popped on the news.

Spending Down a Black Hole?

But that was six months ago.  And oh how things have changed.

Early last month, Intel released a disastrous Q2 earnings report. Revenues missed expectations and resulted in a $1.6 billion net loss. EPS came in at $0.02 vs a $0.10 expectation.

The company announced it was suspending the dividend it’s been paying since 1992.

And now rather than creating tens of thousands of jobs, they announced they would be laying off 15,000 beginning this year.

The company’s stock is down over 60% year to date.

Intel Corp. (INTC) Year to Date.

Source: Barchart.com

Intel CEO Pat Gensler said, “Our revenues have not grown as expected — and we’ve yet to fully benefit from powerful trends, like AI. Our costs are too high, our margins are too low.”

That may be the scariest statement of all. 

For all intents and purposes the AI boom has been fueling the market since late 2022. If they’ve missed the bus for the past two years, it’s hard to imagine how they plan to catch up. 

Intel has a bit of a history of being on the wrong side of industry trends. (Like when it opted not to provide Apple with chips for its iPhone.)

There’s always hope to right the ship. (Meta managed to do it after a disastrous investment in the metaverse.) But right now, Intel is nowhere near equipped to spend $100 billion on anything.

And given all this, is this where the government should be spending $20 billion of your money?

Today’s investing landscape may be as difficult to navigate as it’s ever been. 

This is in large part due to changes that have taken place over the past decades.

Two important distinctions investors should be aware of today.

First…

The Stock Market Is Not the Economy…

Not so long ago, when the US economy was a value-based engine, the stock market could be considered a decent measure of economic activity. 

Manufacturing companies who produced and sold more products earned more money. And investors in those companies were rewarded with higher share prices and often dividend payouts.

Everyone’s a winner.

Today we no longer live in a traditional value-based economy. Sure, we have industries that produce stuff that’s sold here and around the world. But more and more that continues to change.

Today, and for the past roughly 50 years, the stock market has turned from a measure of an industrial economy into a tool of financial elites.

A means to make money from money. Period.

If you want the big picture, think of the golden age of the corporate raider — the time associated with the “Go-Go 80s” and personified by Gordon Gekko in the movie Wall Street.

The strategy back then was to acquire distressed manufacturing companies and drain whatever cash flow they could. Corporate raiders cut capital and operating expenditures and sold off assets. In the immortal words of Gekko himself, they’d wreck a company “because it’s wreckable!”

It wasn’t about investing to grow a company. It was about spending money for a fast return.

But the financialization wasn’t limited to the corporate vultures.

Manufacturing companies themselves even got in on the “make money from money” craze. 

General Motors Acceptance Corporation and Ford Motor Credit were both established decades ago to finance car purchases. But during that same time they began to expand their interests into all sorts of other financial services including mortgages, insurance, banking and commercial finance.

Their financial efforts eventually began to eclipse their main businesses…

In 2004, GM reported that 66 percent of its $1.3 billion quarterly profits came from GMAC; while a day earlier, Ford reported a loss in its automotive operation but $1.17 billion in net income, mostly from its financing operation.

Today, stock buybacks are all the rage. 

After a shaky start earlier this year, Apple announced it would buy back $110 billion of its shares. Without changing a thing in its operations, its share price suddenly exploded making them once again the most valuable company in the world.

Much of the stock market has become addicted to this financialization. And that’s why cheap capital (low interest rates) is so important.

This is an important fact to understand. Stock indexes do NOT represent the economy.

…And Neither Are Economic Reports

The second thing to understand is that “economic reports” don’t accurately represent the economy either.

Case in point.

GDP for the second quarter was just revised upwards to 3% — over doubling the first quarter’s report of 1.4% growth.

If you believe these numbers, business should be booming. 

Yet in the first half of this year, corporate bankruptcies are soaring. 

According to the June S&P Global Market Intelligence report: “The 346 total filings so far in 2024 is also higher than any comparable figure in the prior 13 years.”

Personal consumption expenditures (the fancy name for consumer spending) rose 0.7% in the second quarter as well. But sales numbers for many consumer-facing companies like General Mills…

MINNEAPOLIS – General Mills (NYSE: NYSE:GIS) has confirmed its financial targets for fiscal year 2025, expecting organic net sales to be flat to up 1 percent, and an adjusted operating profit ranging from a 2 percent decline to flat in constant currency.

…Hershey…

The stock of iconic US chocolate maker Hershey tumbled after the company slashed its sales and earnings outlook for the year as shoppers continue to reduce purchases of higher priced chocolates and candies.

Q2 sales plunged 17% to $2.07 billion, sharply missing the $2.31 billion estimate. Adjusted EPS of $1.27 per share also missed expectations.

…even dollar stores…

Shares of Dollar Tree plunged nearly 12% in premarket trading in New York after the discount retailer, which operates thousands of stores nationwide, posted fiscal second-quarter earnings that fell short of Wall Street expectations. The company also slashed its full-year outlook, pointing to mounting financial pressures on middle-income and higher-income customers. This comes less than a week after major rival Dollar General reported a “financially constrained core customer” that sent shares crashing the most on record.

…have been struggling as well.

And then there are all the jobs that have been added to the economy…

Today, given all the potential for revisions and seasonal adjustments, economic reports really don’t mean much where the future of a stock — or even an entire index — goes. 

Heck, they don’t even accurately represent the economy.

These financial and economic “dislocations” can create havoc for investors. 

But we make them our business here, to make sure our readers are the best-informed investors they can be.